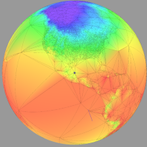
An OpenGL 1.x app to visualize HadCRUT 3 July 2011 global temperature data. Also displays cooling/warming trends, based on simple linear regression.
Hold down the Z/X keys to flip through time month by month. Fancy.
The data was kind of flakey, so I wrote up some quick C++ code to parse it and calculate the cooling/warming trend. I thought a visualization component would be cool too, so I worked on that for a bit. I completed the project about a half a year ago.
The Win32/GLUT binary and source code can be downloaded from http://hadcrut3-july..._viewer_1.0.zip
No real plans at this time to upgrade the app to the new HadCRUT 4 data set (includes more North American data).
The app uses the TetGen library to generate the initial Delaunay triangulation. I went this route because it was just simply faster and more robust than my own Delaunay code. I wrote the remainder of the code. The code is public domain, of course.
Took about two weeks to write. The code is a mess. Have fun.
Click here to view the iotd
🎉 Celebrating 25 Years of GameDev.net! 🎉
Not many can claim 25 years on the Internet! Join us in celebrating this milestone. Learn more about our history, and thank you for being a part of our community!
Popular Topics
Advertisement


