How do these slopes work with the grid?

Started by
13 comments, last by raigan 11 months, 2 weeks ago

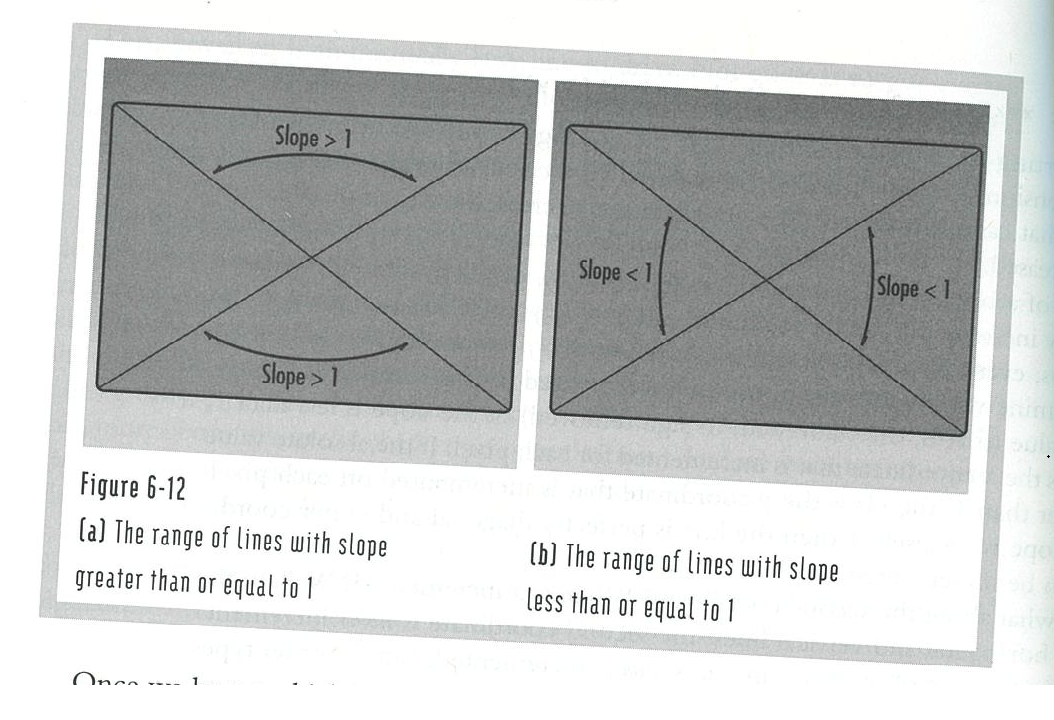
Helllo, everyone. I haven't been around, but I am trying to pick up game development as a hobby now. The picture is a demonstration of a cartesian coordinate system that designates where the slopes are less than or greater than one. How does this work, I don't get it. Sorry about it being crooked, I emailed it to myself from the library. Thanks!

Advertisement

I don't really understand the question, however I would suggest thinking about sloped surfaces differently: the slope-intercept form is a terrible representation to work with, because it doesn't handle vertical lines. IMO it's easier and nicer to represent lines using two points on the line. For collision you often want to represent halfspaces (to distinguish between which side of the line is solid and which is empty), in which case a point on the line and a unit normal vector (which points from the solid side to the empty side, perpendicular to the line) is a useful representation.

Let's consider only lines that pass through the point (0,0). Some example of lines are

y = 2*x

y=-0.04*x

y=x

y=0

x=0

Except for this last one, they all look like y = m * x, where m is a real number we call “slope”. The diagram you posted seems to show you that lines with abs(m) > 1 cover the region of space where abs(y)>abs(x) and lines with abs(m) < 1 cover the region of space where abs(y) < abs(x).

That's as far as I can explain what you posted without context. If that's still confusing, perhaps you can tell us what that section of the book was talking about. Or you can tell us what you are trying to do that led you to read that book in the first place.

The book I am reading is a relic, very old. It is a 3D book and teaches by creating a flight simulator. I thought this would be very interesting, and it uses matrixes, dot product, etc. It uses some assembly and I found it interesting that assembly was explained when using a C++ compiler. The book is written in C++. It is called, “Flights of Fantasy,” and is written by The Waite Group, a publisher I have always enjoyed. The book is very old, but very fun!

Now as far as the illustration, I can now visualize that as the slope goes from 1 to -1 it is less than 1. For positive slopes, is slope zero adjacent to the -1 slope?

Thanks!

“slope” is simply the rate of Y change versus the rate of X change. So if you go from (0, 0) to (2, 1), dx=2 and dy=1 so the slope is dy/dx = 0.5 .

The trigonometric “tan” function captures the connection between slope and angle.

# Slope at 45 degrees (X and Y increase equally fast):
>>> math.tan(math.radians(45))
0.9999999999999999         # I guess close enought to 1

# Straight up (dy > 0 and dx = 0)
>>> math.degrees(math.atan(999999999999999999999999.0))  # infinite, since you're dividing by 0
90.0

Swell, Alberth, thanks so much for the great tangent trick!

Weird, though. The Slopes seem to be reversed. Could you tell me the slope values on the right horizontal slice, please?

From (0, 0) to (2, 0) ? dx=2, dy=0 slope = dy/dx = 0/2 = 0

Since you're discussing straight lines, the slope at each point at the line is the same. For curved lines the slope is the value of its derivative. eg y = x*x, derivative is (which also means slope=) 2*x.

For example

  • at (0, 0) the slope is 0,
  • at (0.1, 0.01) the slope = 2*0.1 = 0.2,
  • at (0.3, 0.09) the slope = 2*0.3 = 0.6,
  • at (1, 1) the slope = 2*1 = 2,
  • at (2, 4) the slope is 2 * 2 = 4.

From the image you provided, the slopes are reversed .. Assuming the X and Y axes are measured the same units.

If the image was a perfect square, the slope from the lower left to the upper right corner would be dy/dx = 1

But it looks like the X axis is longer than the y axis, so dy/dx < 1.

Hopefully this is just a rare typo in the book!

This topic is closed to new replies.

Advertisement